

Ethereum Faces Tough $2,700 Resistance with Decreasing ADX at 14
On September 28, Ethereum’s price slipped 1.5% to around $2,665, coinciding with a rise in oil prices due to stalled talks between the US and Iran. While ETH traded above its daily moving averages, the 4-hour chart indicated a weak trend strength, hovering below $2,700.
Summary
- Ethereum’s price declined after hitting an intraday high of $2,703.
- The 4-hour ADX was recorded at 14.40, with prices nearing the lower Bollinger Band.
- CoinGlass showed notable liquidation clusters around $2,700 and $2,740–$2,750, with another cluster near $2,620.
- Vitalik Buterin referred to Hegota, slated for 2027, as Ethereum’s potentially final “normal” fork.
As reported by Reuters, oil prices rebounded on Monday following President Donald Trump’s rejection of Iran’s latest proposal to resolve tensions and reopen the Strait of Hormuz. This increase in oil prices happened concurrently with a decline in Ethereum and the larger cryptocurrency market.
According to Ethereum’s Binance daily chart, ETH opened at $2,688.65, peaked at $2,703.51, and dropped to a low of $2,635.69. When the TradingView chart was captured, it traded around $2,661. This movement left $2,700 as the immediate recovery target for buyers, while Monday’s low marked the first significant test below $2,650.
Ethereum maintains position above its 20-day moving average
Despite Monday’s downturn, ETH stayed above all four moving averages visible on its daily chart. The 20-day simple moving average was positioned around $2,586.78, and the 50-day average registered at $2,403.66. The 100-day and 200-day averages were roughly at $2,103.59 and $2,104.79, respectively.
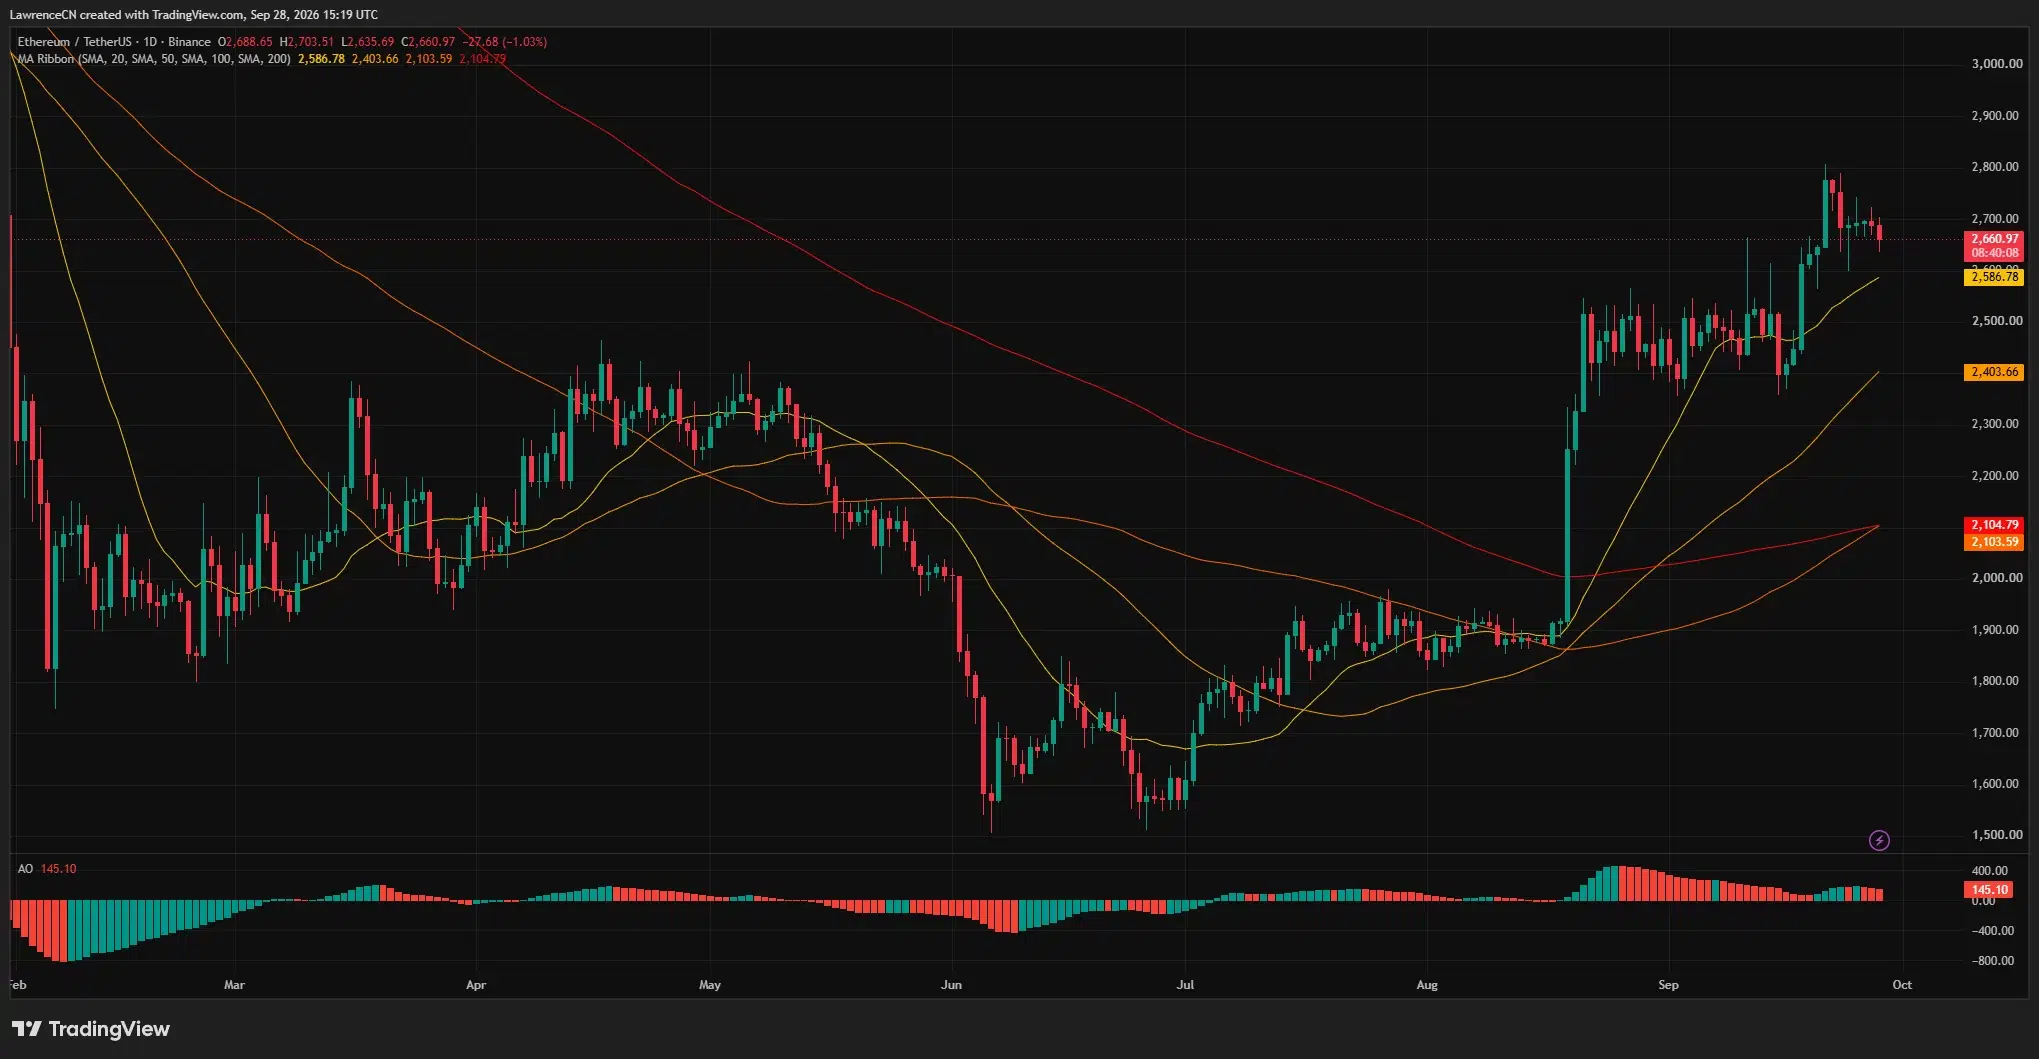
This daily chart positioned the nearest moving average about $74 below ETH’s price at the time of capture. For an upward movement, sellers would need to overcome Monday’s $2,635 low before testing the day’s high of $2,703, potentially bringing the recent price area near $2,800 back into play.
Ethereum’s daily Awesome Oscillator indicated a positive reading of 145.10, despite recent red bars. The indicator remained above zero with its bars showing that momentum was easing from the prior rally. ETH had increased from around $2,400 in mid-September to a peak near $2,800 before experiencing a pullback.
The current 4-hour chart reflected more immediate pressure. ETH traded around $2,661, below the middle Bollinger Band at $2,687.58 and close to the lower band at $2,650.52, with the upper band positioned at $2,724.65.
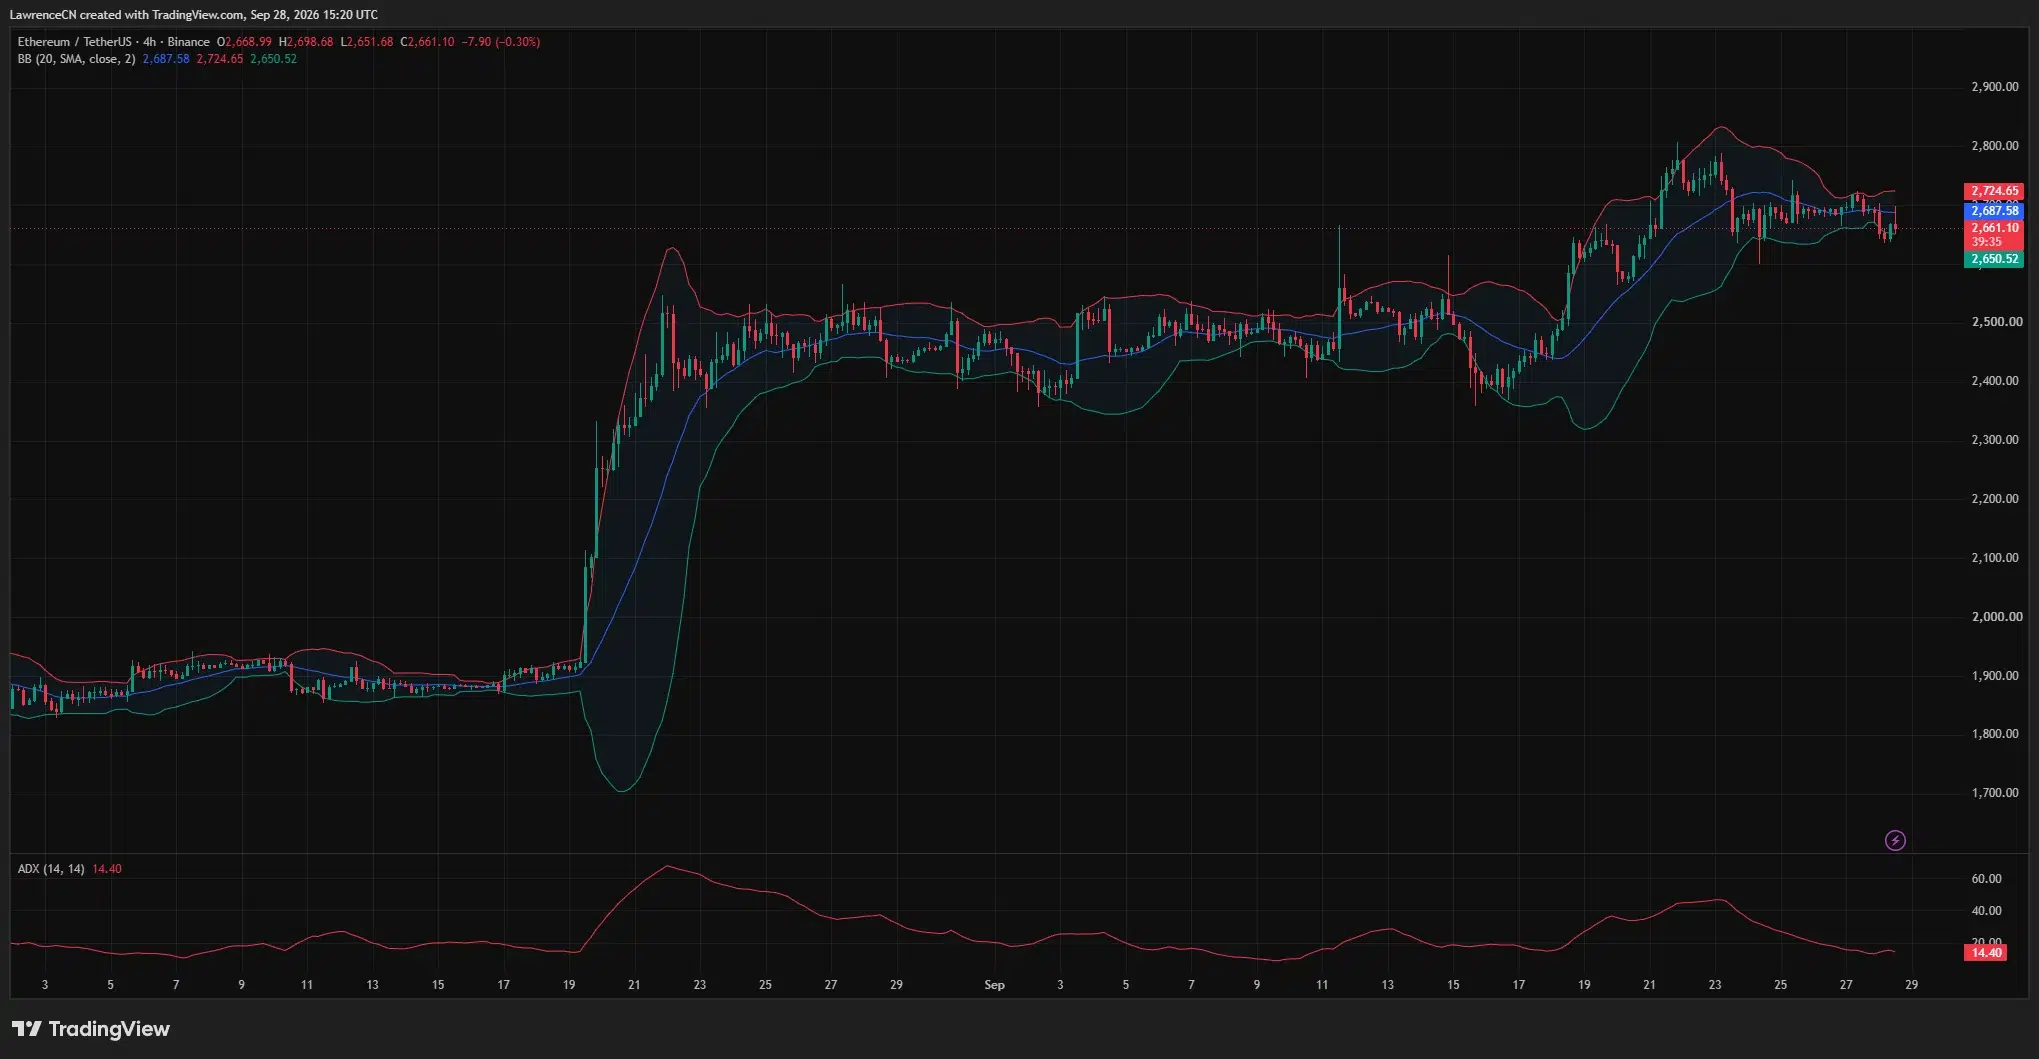
The 4-hour Average Directional Index (ADX) dropped to 14.40, indicating weak trend strength as ETH traded sideways below its recent high. An increase above the middle Bollinger Band would refocus attention on $2,700 and subsequently on the upper band near $2,725. Conversely, a move below the lower band might bring Monday’s low of $2,635 back into scrutiny.
Liquidation bands define the $2,700 examination
The three-day ETH liquidation heatmap from CoinGlass indicated a band around $2,700, with brighter concentrations near $2,740–$2,750. These levels were situated above ETH’s price when the map was captured, with the higher band positioned beyond the upper Bollinger Band on the 4-hour chart.
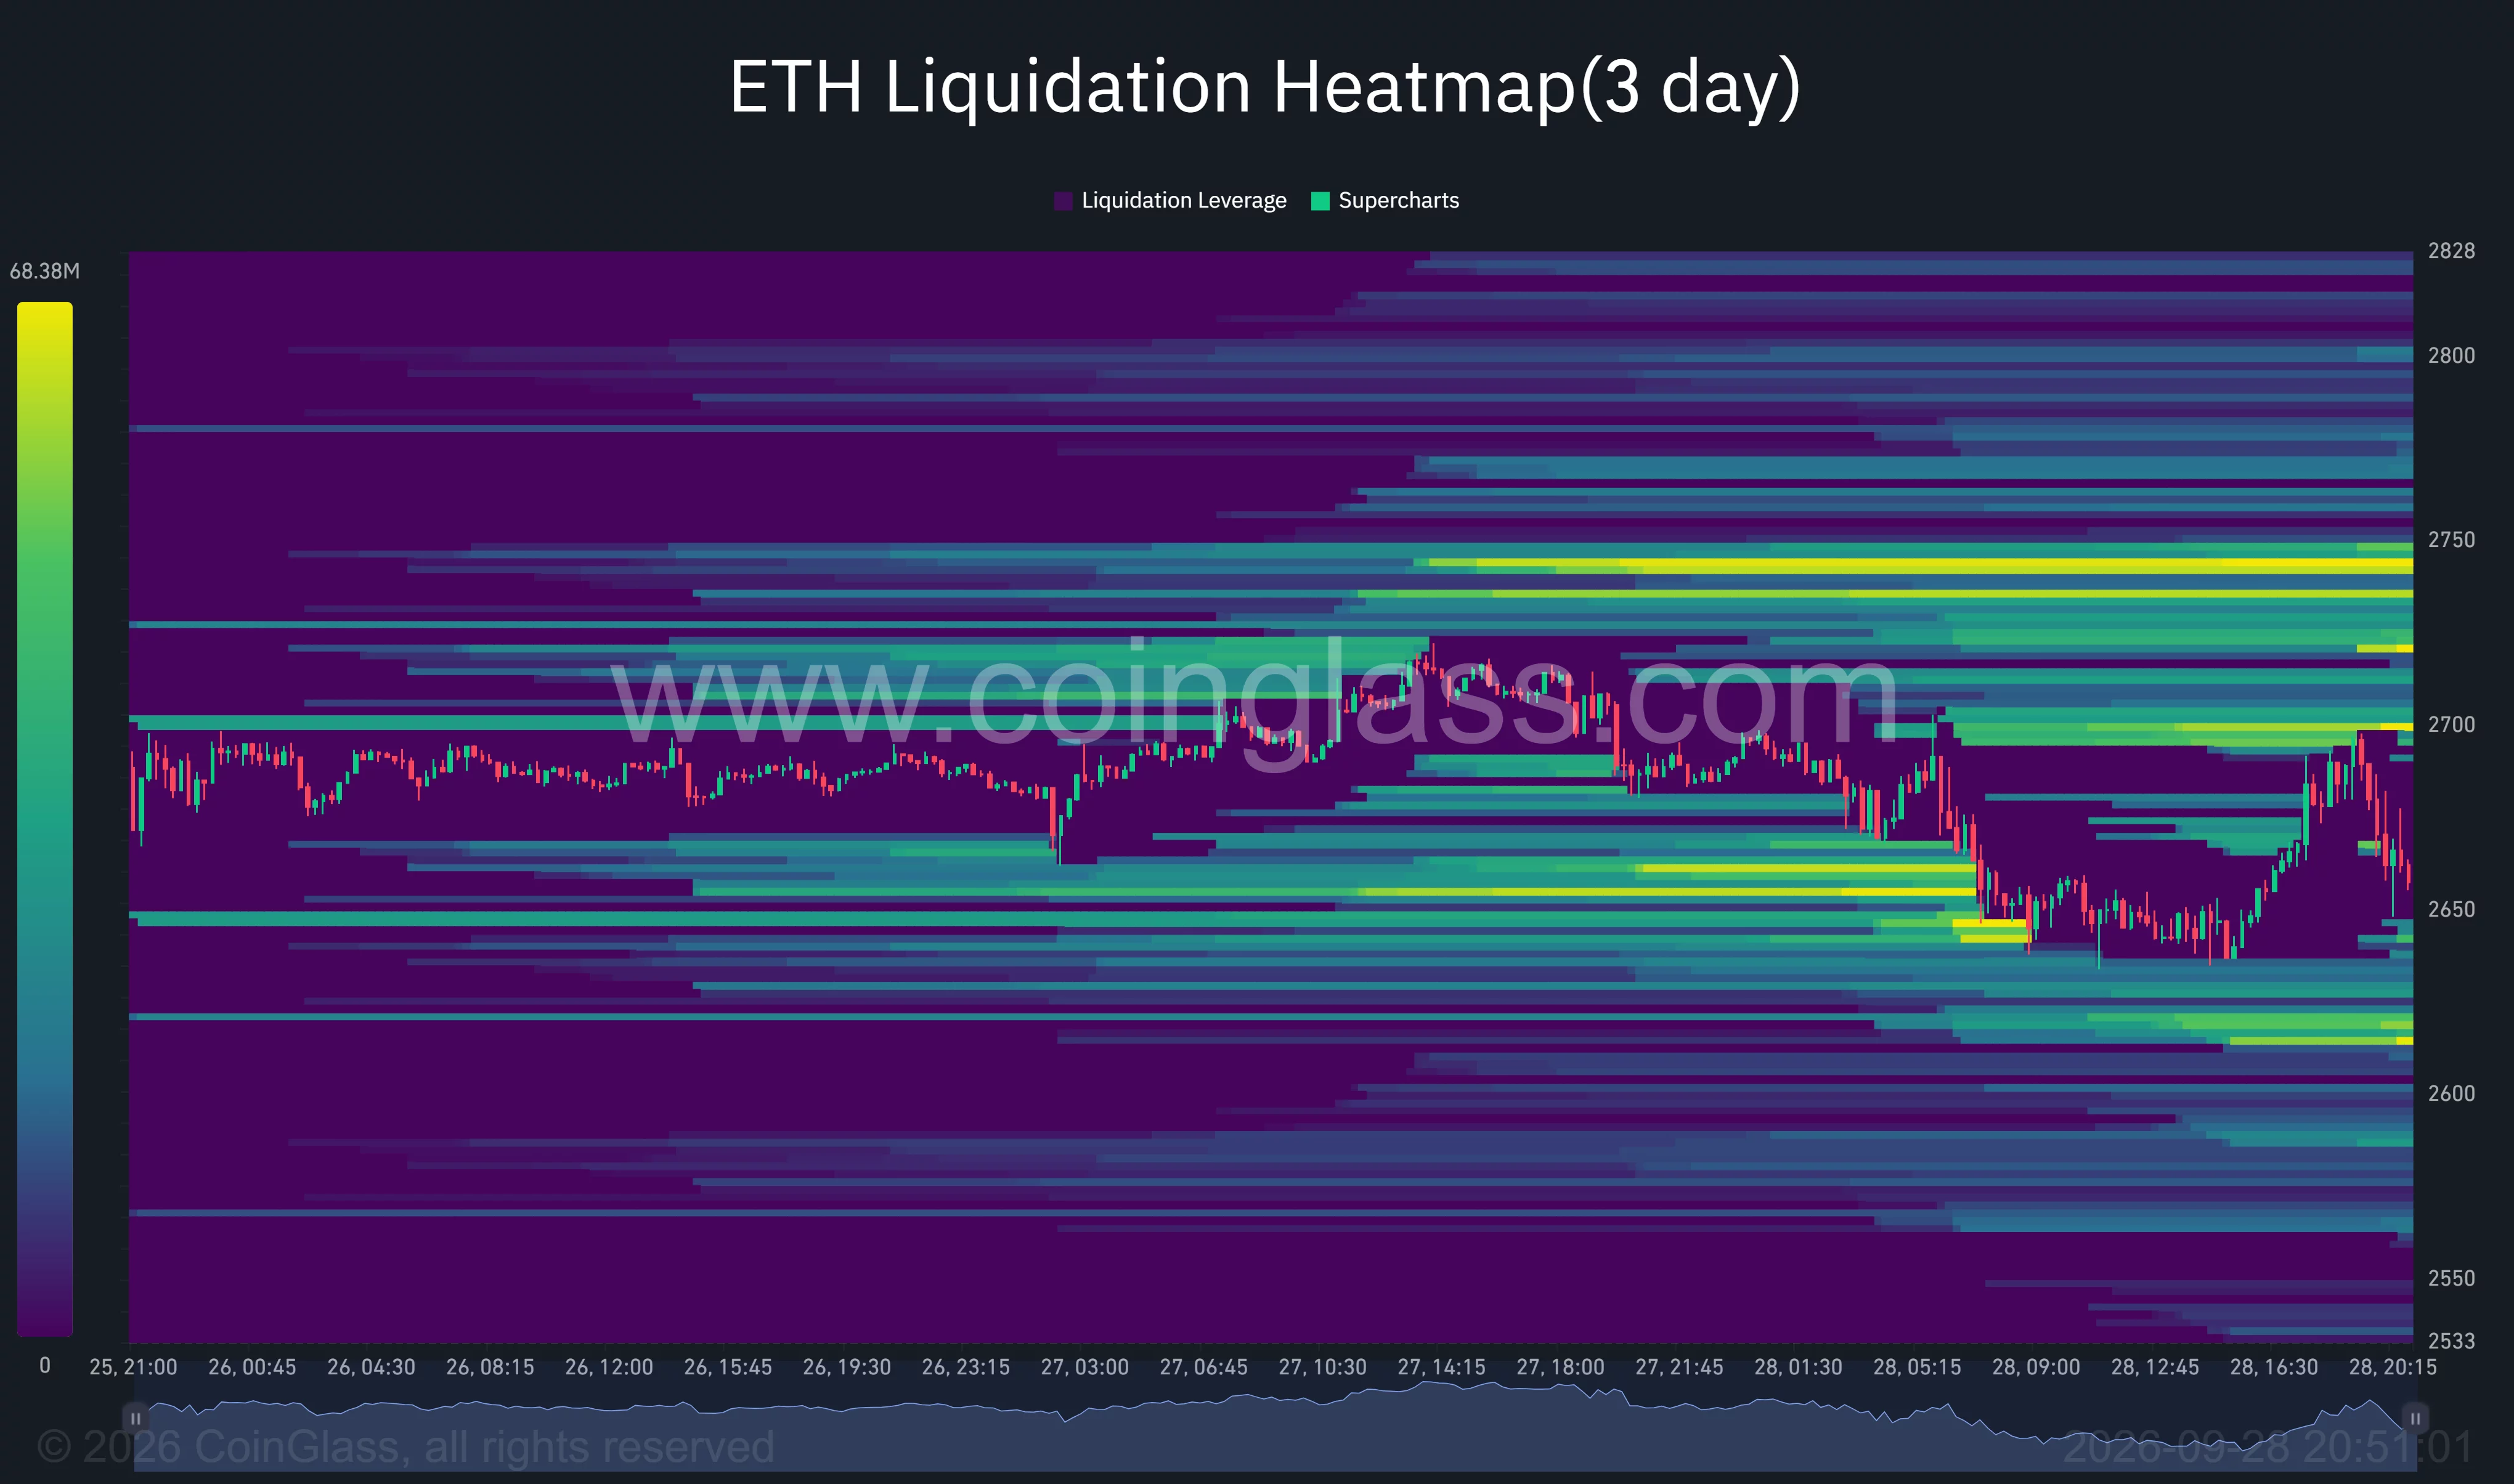
Below current market levels, the heatmap indicated activity around $2,640–$2,650 and another band near $2,620. ETH had traversed part of the upper region during Monday’s decline before making a recovery. These bands represent prices at which leveraged positions may face liquidation; their sizes and positions may shift as traders amend their positions.
Crypto analyst Ella mentioned she was monitoring the $2,715–$2,720 range as the first upside test following ETH’s rebound from around $2,667. She projected $2,740 as the subsequent level if buyers maintained that range. Conversely, she noted that a drop below $2,680 could prompt another test of $2,665.
Analyst Gerla commented on ETH’s relative strength index, which was forming lower highs while the price sustained its broader breakout structure. Gerla pinpointed $2,400–$2,450 as a key support area, asserting that a rise above $2,830 could target $3,400. These levels describe a longer-term analysis compared to the closer bands on the 4-hour chart.
Hegota roadmap provides long-term insight
Vitalik Buterin, co-founder of Ethereum, wrote on September 27 that the Hegota upgrade, planned for 2027, would most likely be Ethereum’s final “normal” fork. He mentioned that future updates would incorporate recursive STARKs, automated formal verification, enhanced consensus methods, and initiatives aimed at quantum safety.
Buterin elaborated on a long-term evolution of Ethereum’s architecture, wherein the network integrates its blockchain with additional cryptographic verification and decentralized systems external to the base chain. His remarks did not specify any near-term ETH price targets.
For the current price dynamics, the levels appear in close proximity. To maintain upward momentum, ETH must reclaim the 4-hour Bollinger midpoint around $2,688 and hold above $2,700 before challenging the upper band near $2,725 and the liquidation cluster around $2,740–$2,750. Conversely, a breach below Monday’s low of $2,635 would bring the lower cluster near $2,620 into sight, followed by the daily 20-day average close to $2,587.
US investors are also closely following the oil market, given the latest developments in US-Iran discussions. Ethereum’s performance around $2,650 and $2,700 will be crucial in determining whether Monday’s downward trend continues or if prices revert to the range observed below its September highs.
Disclosure: This article does not constitute investment advice. The content and materials presented on this page are intended for educational purposes only.