

Could Ethereum Reach a $3,000 Price Point in October?
As October begins, Ethereum’s price hovers around $2,695, following a remarkable 32.6% gain in August and an additional 8.8% rise in September. This sets the stage for a pivotal resistance level between $2,775 and $2,800 that ETH must overcome to potentially reach the $3,000 mark.
Summary
- Ethereum is trading around $2,695, with the pivotal resistance area between $2,775 and $2,800 as October begins.
- During the latest trading week, U.S. spot Ether ETFs saw net outflows of $118 million.
- The Glamsterdam upgrade is set to activate on Sepolia on October 6, with mainnet timelines yet to be confirmed.
- After achieving gains of 32.6% in August and 8.8% in September, Ethereum is now consolidating around $2,700.
- A decisive move above $2,800 could lead Ethereum towards $3,000, while the $2,400–$2,500 range is deemed critical support.
According to CoinGecko, ETH was trading between $2,693 and $2,695 on October 4, reflecting a 0.7% increase over the last 24 hours and remaining nearly stable over the past week. The token fluctuated between approximately $2,678 and $2,697 during the latest 24-hour trading period, with a market cap close to $328 billion.
During the initial days of October, Ethereum has maintained a close range around $2,700 after reaching an intraday peak of about $2,775 on October 2. However, this peak could not be sustained, leading to a drop back below $2,700, where it stabilized throughout the weekend.
Ethereum price must break $2,800 to reach $3,000
ETH has largely completed the recovery setup established during August and September. Historical data reveals that Ethereum ended August at approximately $2,467, having gained about 32.6% for the month. September added another approximate 8.8% gain, with ETH closing around $2,685.
Momentum notably accelerated in late September, with ETH rising from roughly $2,398 on September 15 to $2,775 by September 21, subsequently retreating back into the $2,650–$2,700 range. This movement allowed Ethereum to surpass the previous $2,400–$2,550 consolidation range but fell short of securing support above $2,800.
Technical analysis indicated a similar structure post breakout above resistance at approximately $2,661.52. Interim resistance appears to be situated between $2,775 and $2,825, with a breakout target of around $3,050 if the upward momentum is maintained. Conversely, a decline to about $2,560–$2,565 would compromise this bullish setup.
For October, the immediacy of the bullish narrative hinges on a relatively narrow price range. Ethereum must first close convincingly above the $2,775–$2,800 range. Sustaining that area as support would reestablish targets at $2,900 and $3,000, while an existing upward channel suggests possible targets between $2,950 and $3,100 later in the month if bullish momentum continues.
The month’s TradingView chart indicates that RSI is at 51.53, surpassing its moving average of 48.46. A reading above 50 suggests an improving momentum, though it remains far from the 70 mark typically associated with an overbought condition.
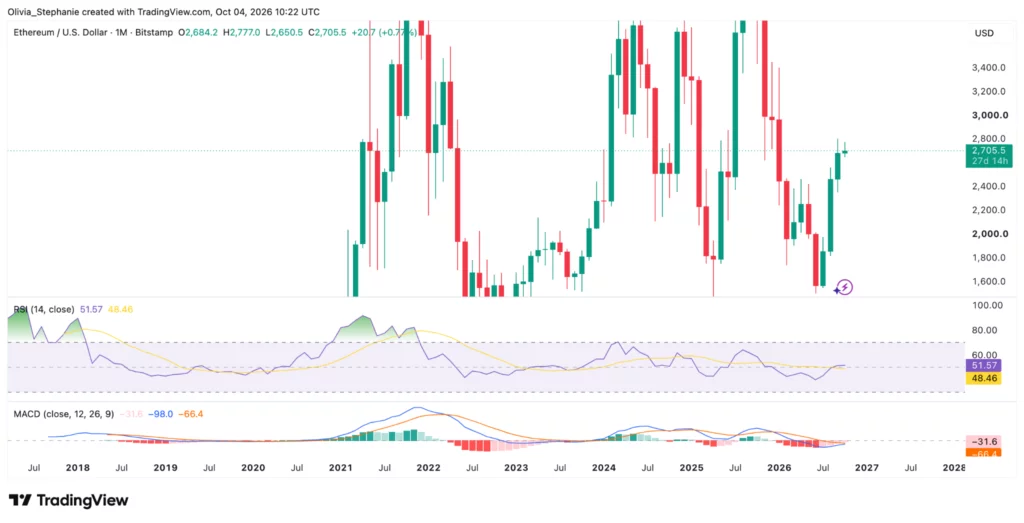
The MACD indicator shows weaker performance, with the monthly MACD line at around -98.3 and the signal line nearby at -66.4, leaving the histogram close to -31.9. Although the lines have converged, a bullish crossover is still not evident.
ETF interest has decreased following BlackRock’s purchases in September
Institutional interest supported prices during September; however, the latest ETF statistics indicate that buying momentum has stalled.
Arkham Intelligence reported on September 17 that BlackRock’s Ethereum funds purchased approximately $1.57 billion worth of ETH over the previous 20 days. ETHA accounted for about $1.27 billion, while ETHB made up another $296.5 million. These figures represent assets acquired by ETF products for investors, rather than ETH acquired for BlackRock’s corporate holdings.
More recent data paints a less optimistic picture. Farside Investors noted $59.6 million in combined U.S. spot Ether ETF outflows on September 30, followed by outflows of $55.4 million on October 1 and $17.3 million on October 2. Across the week from September 28 to October 2, total net outflows reached approximately $118 million.
As reported by crypto.news, these Ethereum ETF outflows stand in stark contrast to the previous week, during which the products attracted around $689.8 million.
These figures suggest a more mixed outlook for ETFs in October compared to the mid-September data regarding BlackRock’s buying activity. BlackRock’s earlier accumulation had established robust demand during part of September, while recent figures indicate capital exiting the U.S. Ether ETF sector as October commenced.
Exchange-flow data shared by CryptoQuant analyst R3N presents a similarly balanced narrative on-chain. During most of September, Ethereum’s exchange inflows and outflows tracked closely, with often large two-way spikes on identical dates.
Recent observations revealed about 129,700 ETH exiting exchanges contrasted with 116,700 ETH entering them, marking the first clear divergence following weeks of largely matched flows; however, R3N cautioned that one data point does not confirm a lasting accumulation trend.
Glamsterdam brings an important event to Ethereum on October 6
Ethereum’s next significant network upgrade will reach a critical test on October 6.
The Ethereum Foundation has announced that Glamsterdam will activate on the Sepolia testnet at 13:53:36 UTC on October 6. Node operators on Sepolia must update both execution and consensus clients ahead of the fork. The activation dates for Hoodi and the Ethereum mainnet are yet to be finalized.
Glamsterdam fuses the Amsterdam execution-layer upgrade with Gloas consensus-layer improvements. Key features include embedded proposer-builder separation, block-level access lists, and modifications to gas pricing, aimed at refining Ethereum’s execution and state growth management.
As noted in crypto.news’ coverage of Glamsterdam, the Sepolia activation represents a public testing milestone and should not be characterized as an Ethereum mainnet launch.
According to the current Ethereum roadmap, Glamsterdam is slated for mainnet deployment in Q4 2026, although the exact date remains unconfirmed. The outcomes from Sepolia and subsequent testing will guide future implementation stages.
Another notable development in the U.S. market occurred on October 2, with the Securities and Exchange Commission approving a Cboe BZX rule change allowing the listing of a 3x Ether ETF alongside leveraged products related to Bitcoin, gold, silver, crude oil, and natural gas.
This new product aims to achieve three times the daily performance of an Ether futures benchmark. However, SEC approval of the exchange rule does not infer a forecast for ETH or guarantee additional spot demand.
Ethereum price forecast for October indicates three potential scenarios
Is it possible for Ethereum to reach $3,000 in October?
Ethereum has the potential to reach $3,000 within its current technical framework if ETH breaks and sustains above approximately $2,775–$2,800. Technical analysis indicates a continuation target around $3,050 following the latest breakout; meanwhile, failure to maintain above $2,800 would keep ETH confined within its present consolidation range.
What is the primary resistance level for Ethereum?
The nearest resistance level lies around $2,775–$2,800. ETH reached approximately $2,775 on October 2 but was unable to maintain that position, making it the primary short-term cap.
Which Ethereum price point would undermine the bullish outlook?
A drop below roughly $2,560 would weaken the near-term recovery, while the region of $2,400–$2,500 serves as a larger support level within the current ascending channel framework. An additional cautionary technical area lies around $2,350–$2,360.
When will Ethereum’s Glamsterdam upgrade take place?
The Glamsterdam upgrade is set to be activated on the Sepolia testnet on October 6 at 13:53:36 UTC. The Ethereum developers have yet to announce the final activation dates for both Hoodi and the mainnet.
Are Ethereum ETFs still experiencing robust inflows?
Not in the latest week. U.S. spot Ether ETFs faced approximately $118 million in net outflows from September 28 through October 2, following a period during the preceding week that attracted $689.8 million.
Disclosure: This article is not investment advice. The content and materials presented on this page are purely for educational purposes.