

Could Hedera’s Price Reach Over $0.12 in October as Positive Weekly Indicators Emerge?
The price of Hedera has dipped approximately 23% from its late-September peak of around $0.131, currently hovering near $0.101 as traders evaluate whether the $0.10 support level can endure through October.
Summary
- The current trading price of Hedera stands at around $0.101 after much of the late-September surge towards $0.131 was relinquished.
- The daily Ichimoku conversion line is positioned at $0.11166, indicating a level above the token’s recent price.
- Weekly Supertrend support is established at $0.06943, with the Awesome Oscillator now turning positive.
- CoinGlass reports high liquidation concentrations around $0.107–$0.114, with additional bands below $0.10.
According to TradingView’s Binance HBAR/USDT daily chart, Hedera is priced at $0.10120, reflecting a decline of 2.70% in the current session. The token fluctuated between $0.10019 and $0.10489, remaining close to the critical support level around $0.10.
The late-September rally briefly pushed HBAR toward $0.131, but a significant reversal has since returned it to the low-$0.10 range. This decline translates to approximately 22.7%, while regaining the peak would necessitate a 29.4% increase from $0.10120.
There is a divergence between daily and weekly charts. The daily price movements reflect weaker momentum post-spike, while the weekly chart indicates a bullish Supertrend signal and positive momentum. The potential for an October recovery therefore hinges on whether the nearby support can withstand pressure as HBAR confronts resistance levels above its current price.
Hedera price encounters an initial challenge at $0.1117
On TradingView’s daily chart, the Ichimoku conversion line is at $0.11166, with the baseline at $0.10146. HBAR is situated just below the baseline and approximately 9.4% under the conversion line, presenting two distinct obstacles above its latest price.
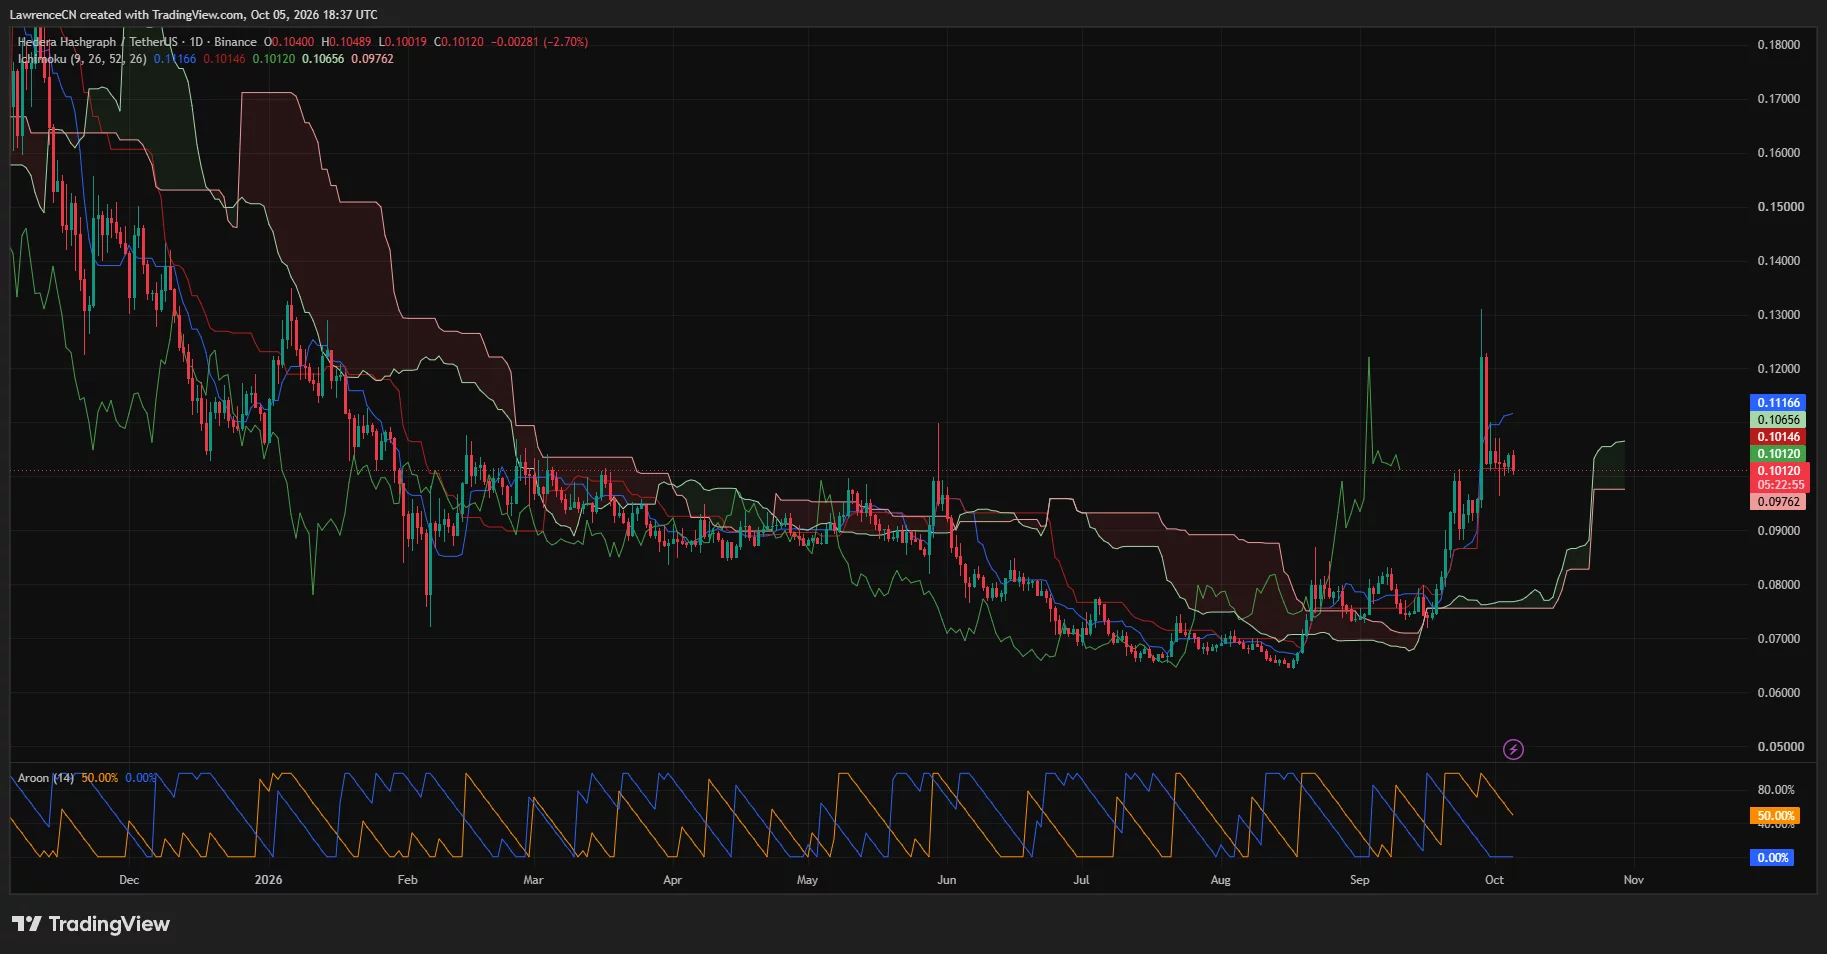
Achieving a recovery past $0.10146 would elevate the price above the baseline. Maintaining that level through a subsequent pullback could support an initiative towards the conversion line; however, the considerable gap to $0.11166 indicates significant ground that buyers need to recover.
The projected Ichimoku cloud covers approximately $0.09762–$0.10656, with its lower edge lying beneath the current price. The upper edge is about 5.3% higher, providing another nearby reference point for a potential October rebound.
The cloud is expected to transition to green, though HBAR continues to sit below the daily conversion line. In a bullish scenario based on the chart, the price would first recover the baseline and then ascend past $0.10656 before tackling $0.11166. Any rejection at these higher levels would indicate an incomplete recovery.
Daily Aroon readings reveal Aroon Up at 50% and Aroon Down at 0%. The upward reading has softened from its stronger late-September levels, correlating with the increasing distance from the recent peak, while the downward reading remains low due to the longer lookback not recording a new low.
Overall, the daily indicators present a mixed setup for HBAR. Although the price has lost the sharp upward momentum of the September rally, the Aroon readings do not exhibit a new low dominating the same observation window. Holding $0.10 would uphold immediate consolidation; regaining $0.11166 would offer a more robust recovery signal.
Weekly momentum shows improvement below $0.1405 resistance
From TradingView’s weekly chart, HBAR is recorded at $0.10126, with the Supertrend support line situated at $0.06943. This indicator has shifted to green following the recent recovery, positioning its support approximately 31.4% below the latest weekly price.
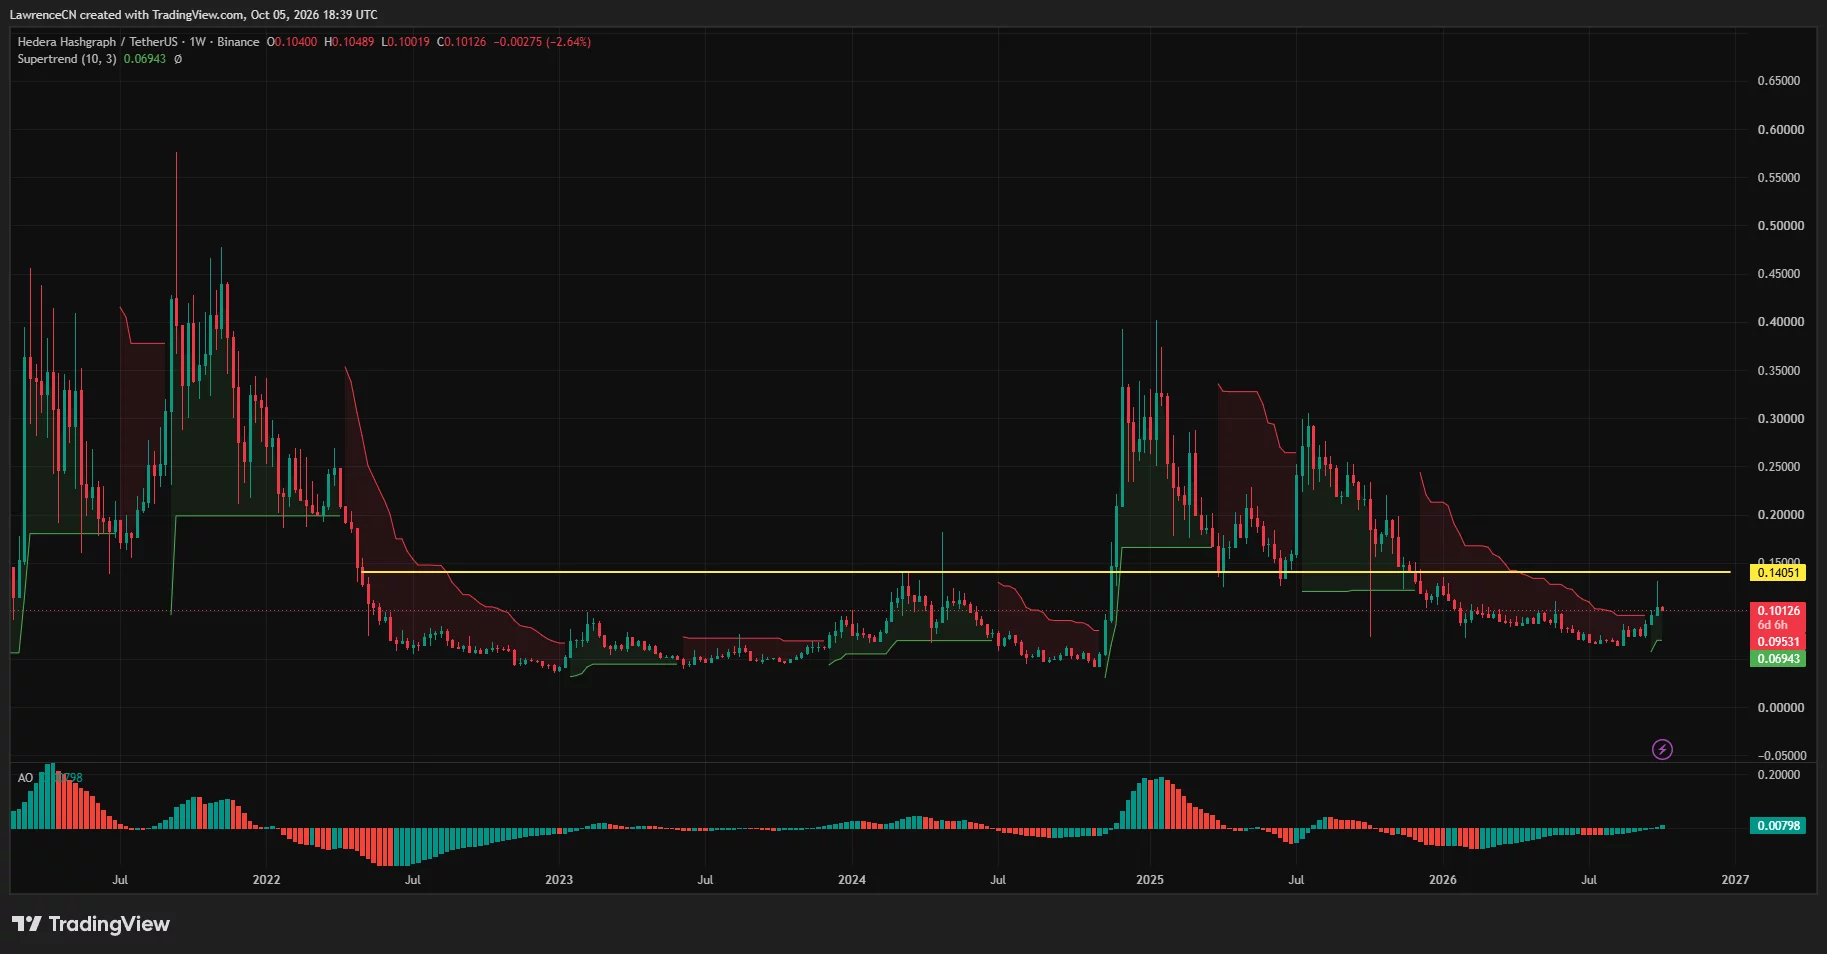
The weekly Awesome Oscillator posts a value of 0.00798, demonstrating green bars above zero. Its entry into positive territory follows a prolonged period of negative readings, suggesting that the weekly recovery carries a stronger momentum signal compared to the latest daily pullbacks alone.
Nevertheless, the chart’s significant horizontal resistance at $0.14051 remains far above the present market value. HBAR would need to climb around 38.8% from $0.10126 to reach this level, marking it as a key recovery objective following the clearing of nearer resistance zones.
The weekly price history indicates several prior reactions in the $0.14 area. Returning to this zone would place HBAR back in a price territory that functioned as a turning point in earlier market cycles, rather than merely extending the recent rebound into an untested zone.
The late-September high nearing $0.131 precedes this weekly resistance. In a bullish scenario for October, a breakthrough above $0.11166 would initiate a challenge at $0.12, followed by the recent peak. Breaking and maintaining positions above $0.131 would then highlight the notable $0.14051 resistance.
The weekly Supertrend provides a reference for downside potential, yet $0.10 remains the immediate test. A token can maintain a bullish weekly indicator while undergoing a substantial daily correction, especially when the indicator’s support line is situated far below market levels.
Giannis Andreou suggests recovery hinges on $0.085–$0.10 support
On October 5, analyst Giannis Andreou identified $0.12–$0.15 as Hedera’s upcoming weekly resistance area in a post on X. His optimistic outlook requires the $0.085–$0.10 range to hold through a retest, followed by a persistent recovery above this resistance.
“My bullish scenario necessitates that $0.085–$0.10 holds through a retest, followed by a sustained recovery above that resistance.”
Andreou’s support range encompasses the current test at $0.10 while extending below that threshold. Within his framework, a short-term dip below $0.10 would not definitively invalidate the broader recovery, given that HBAR finds support within the wider band and subsequently recovers.
The analyst noted $0.20 and $0.40 as higher targets, with the historical peak around $0.576 and beyond, characterizing these prices as part of a comprehensive recovery scenario, with a weekly close below $0.055 negating his setup.
For the month of October, his more immediate reference is the $0.12–$0.15 resistance range. The broader targets will hinge on prior barriers being surpassed and were not suggested as forecasts for the month.
Liquidation bands delineate potential movements around $0.10
According to CoinGlass’s one-month HBAR liquidation heatmap, notable overhead concentrations exist between $0.107–$0.114. Additional bands appear from around $0.12–$0.125 and near $0.132, broadly coinciding with the price zones that HBAR would encounter during a recovery towards its September peak.
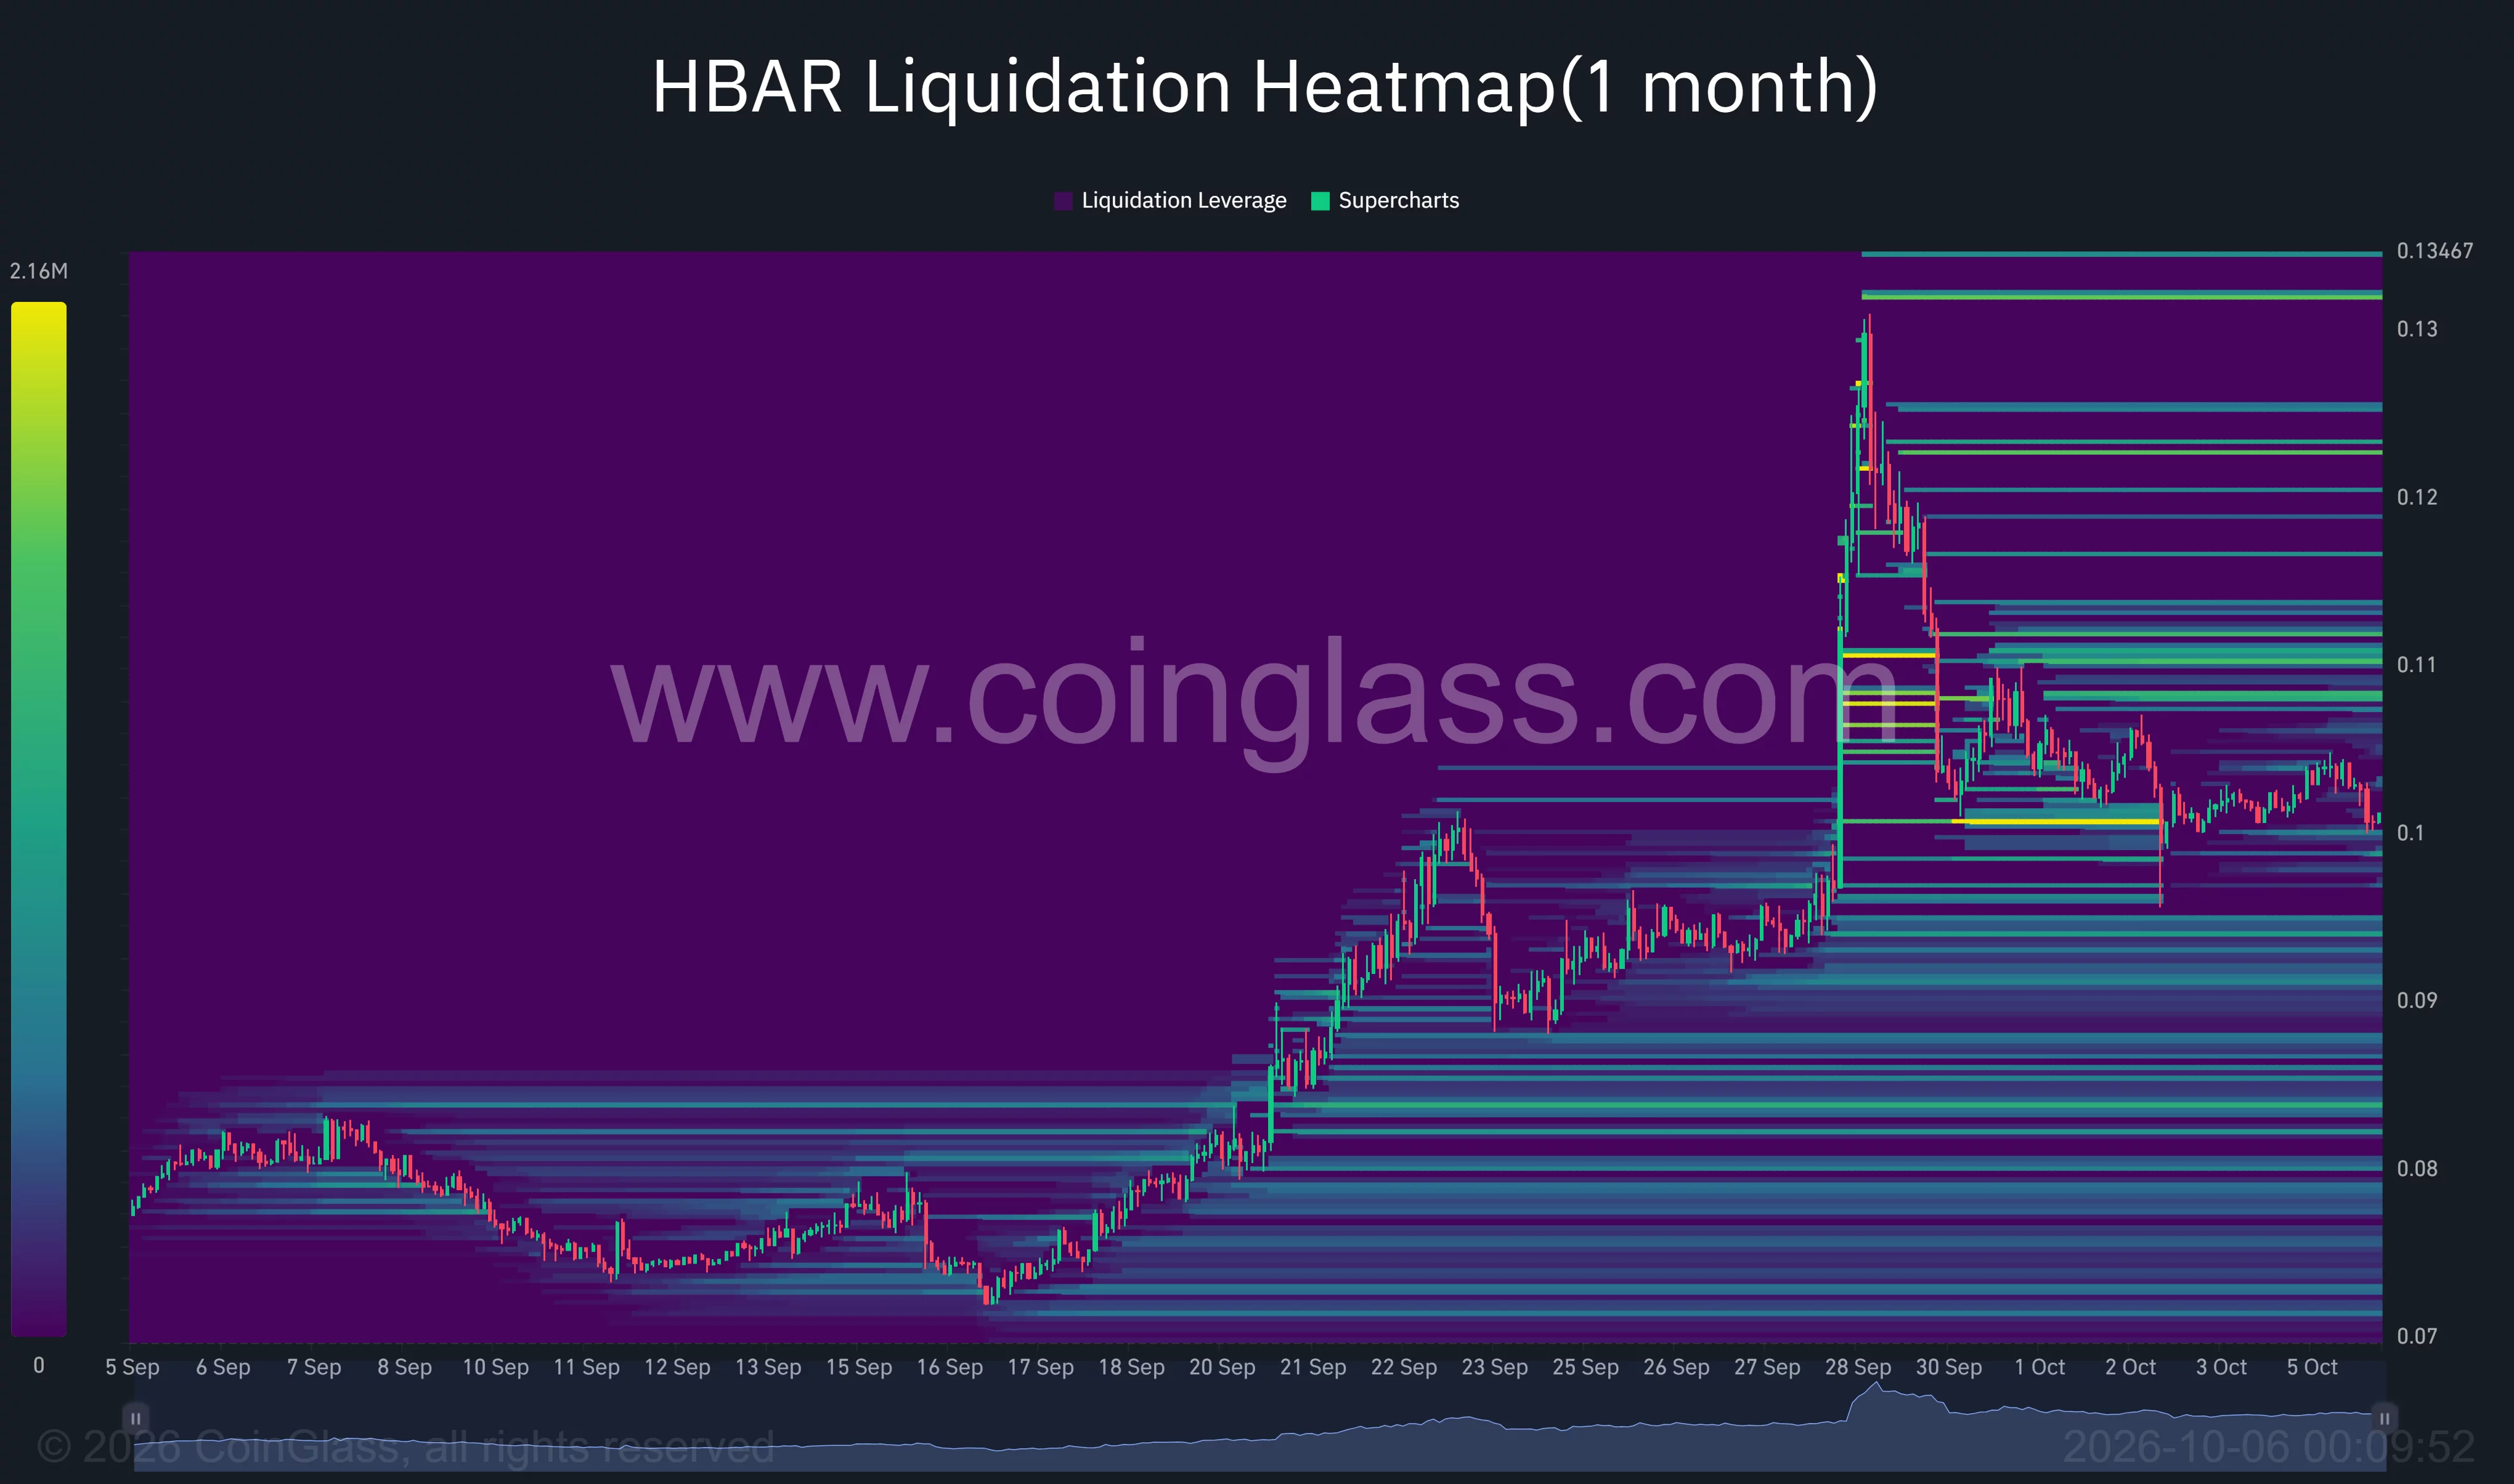
Below the current market level, the heatmap indicates concentrations around $0.098, $0.094–$0.095, and $0.091–$0.092. Additional bands are present in the high-$0.08 range, establishing lower reference points should the current support level falter.
The immediate bearish scenario based on the chart starts with a sustained decline below $0.10, followed by an inability to recover this level. A drop under the forward cloud’s $0.09762 lower boundary would then redirect attention to the $0.094–$0.095 area, where September’s price consolidation and liquidation concentrations converge.
Failure to maintain that area would expose the next visible zone near $0.09. Andreou’s proposed lower support boundary of $0.085 would then come into play during a deeper correction, before addressing the more distant weekly Supertrend level at $0.06943.
IBM development adds context as October resistance builds
The Hashgraph Group announced on September 23 that its Hedera-based IDTrust identity platform has been validated and listed in the IBM Cloud Catalog. The company described this product as a digital identity platform offering verifiable identities for AI agents.
Additionally, IBM announced on September 28 that its IBM Agent Identity and HashiCorp Vault would integrate with NVIDIA OpenShell, which has been recognized as part of its efforts around NVIDIA’s Open Agent Safety Platform.
For US investors, Nasdaq’s listing notice confirmed that the Canary HBAR ETF commenced trading under HBR on October 28, 2025. This listing provides a US exchange-traded avenue for HBAR exposure alongside direct token ownership.
The technical outlook for October continues to concentrate on the support at $0.10 and the daily conversion line at $0.11166. Maintaining this support and surpassing the conversion line would bolster the case for $0.12–$0.131, while a sustained breach beneath $0.09762 would shift focus towards $0.095 and $0.09.
Disclosure: This article does not represent investment advice. The content and materials featured on this page are for educational purposes only.