

Bitcoin Price Prediction: What Can We Anticipate for BTC in October
The price of Bitcoin has climbed back to approximately $83,000 after briefly testing the $80,400 mark; however, decreasing daily momentum combined with a positive weekly breakout means its outlook for October relies on maintaining the support zone between $79,600 and $80,400.
Summary
- The daily Supertrend support for Bitcoin lies at $79,663, just below its recovery toward $83,000.
- The daily MACD indicator remains in a bearish state, with its histogram declining to around negative 537.
- Bitcoin’s weekly chart indicates it remains above the upper limit of a falling wedge pattern.
- A significant concentration of leveraged positions is evident near the $87,000 mark according to the liquidation heatmap.
According to TradingView, the Binance BTC/USDT daily chart listed Bitcoin at $83,012 on October 9, while the weekly chart recorded $82,928. The weekly performance showed a decrease of 4.16%, following a peak of $86,999 and a low of $80,394.
Consequently, Bitcoin’s recovery has shortened the gap from recent highs without reversing the weekly downturn. The charts show conflicting signals for the remainder of October: while short-term momentum is fading, the broader recovery from summer’s lows remains strong.
Bitcoin’s $80,000 support faces critical examination
In the daily TradingView chart, Bitcoin is above its green Supertrend line located at $79,663.52. Although the indicator continues to reflect a bullish trend, the recent pullback has brought the price closer to this critical level.
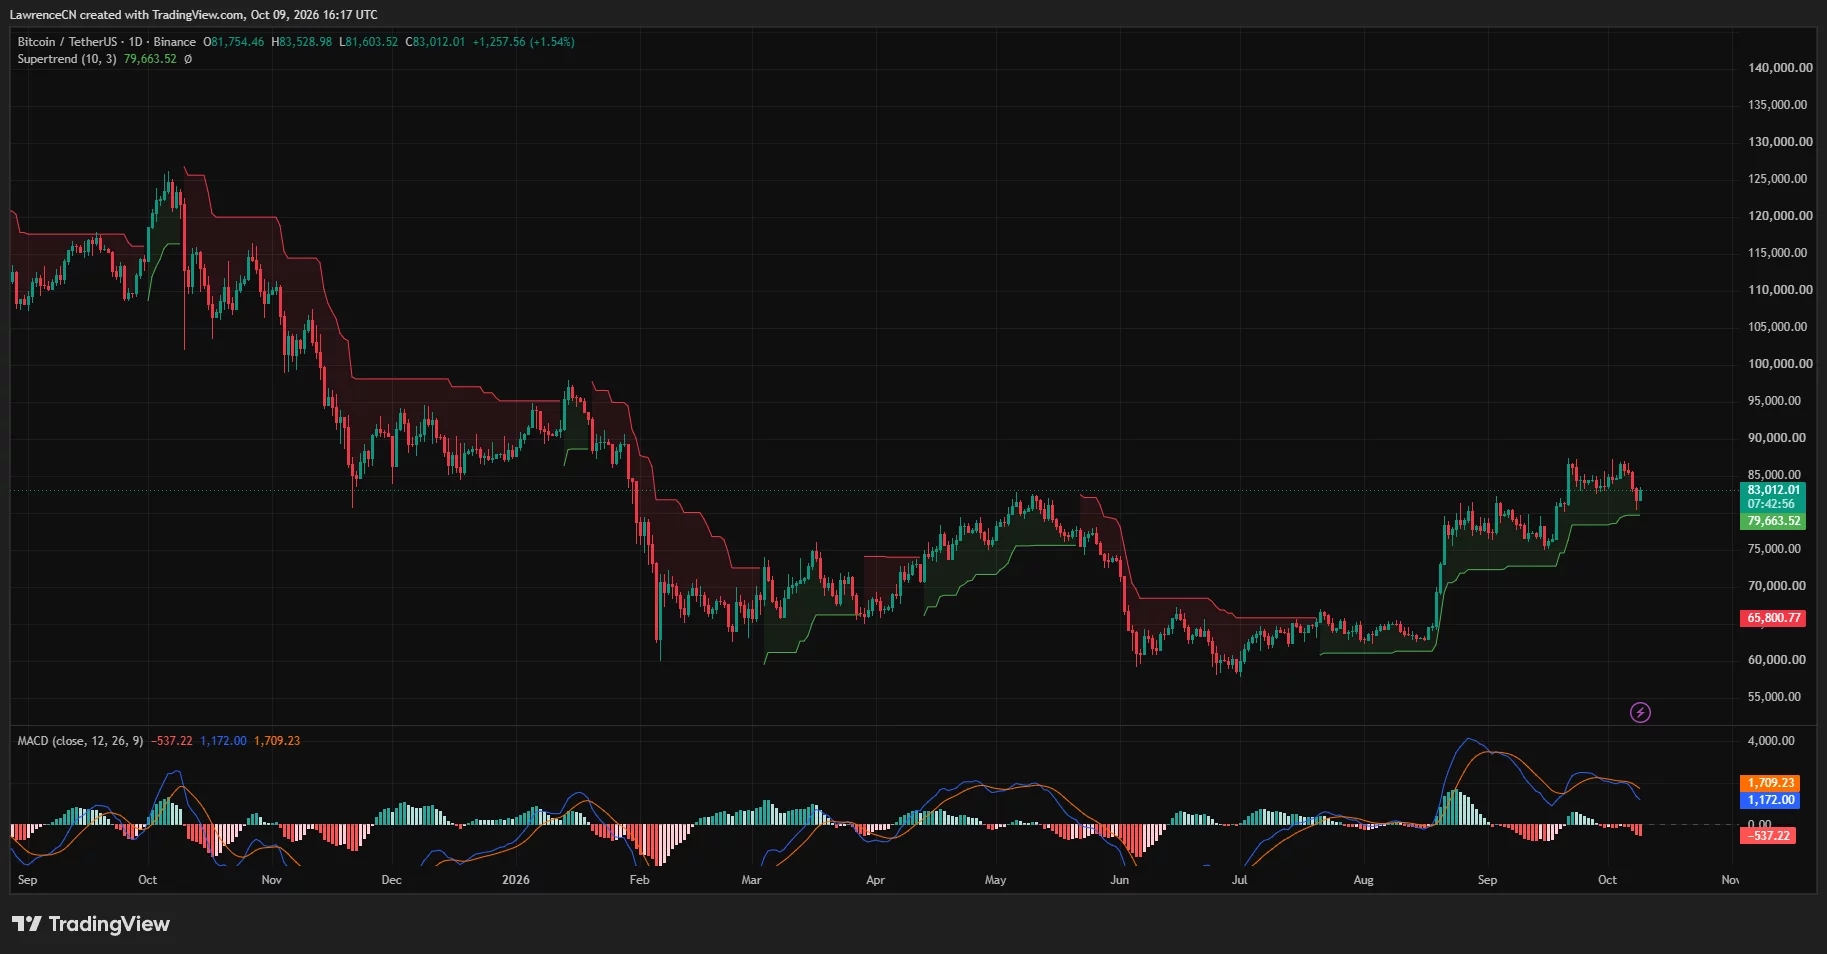
In conjunction, the Supertrend reading and recent weekly low suggest that the nearest significant support area is between $79,600 and $80,400. A sustained drop below this range would compromise the daily recovery pattern and could lead Bitcoin back toward the previous trading range around $75,000 to $76,000.
The daily MACD presents a more cautious viewpoint, with the blue line at 1,172, below the orange signal line at 1,709.23, and the histogram showing negative 537.22.
This bearish crossover indicates that upward momentum is slowing, despite Bitcoin’s recovery. Nevertheless, both MACD lines remain above zero, differentiating the current loss of momentum from a completely negative reading across the indicator.
Given these chart indicators, another support test is viable unless Bitcoin can regain momentum above the nearby resistance levels. A recovery through the $84,000 to $85,000 range would signal initial improvement, while the previous highs around $86,500 to $87,000 represent a more critical hurdle.
The weekly breakout sustains recovery possibilities
Bitcoin’s weekly TradingView chart indicates the price is situated above the upper boundary of a falling wedge established during the decline from its 2025 peaks. This breakout happened prior to the recent pullback, and the latest candles remain above that descending line.
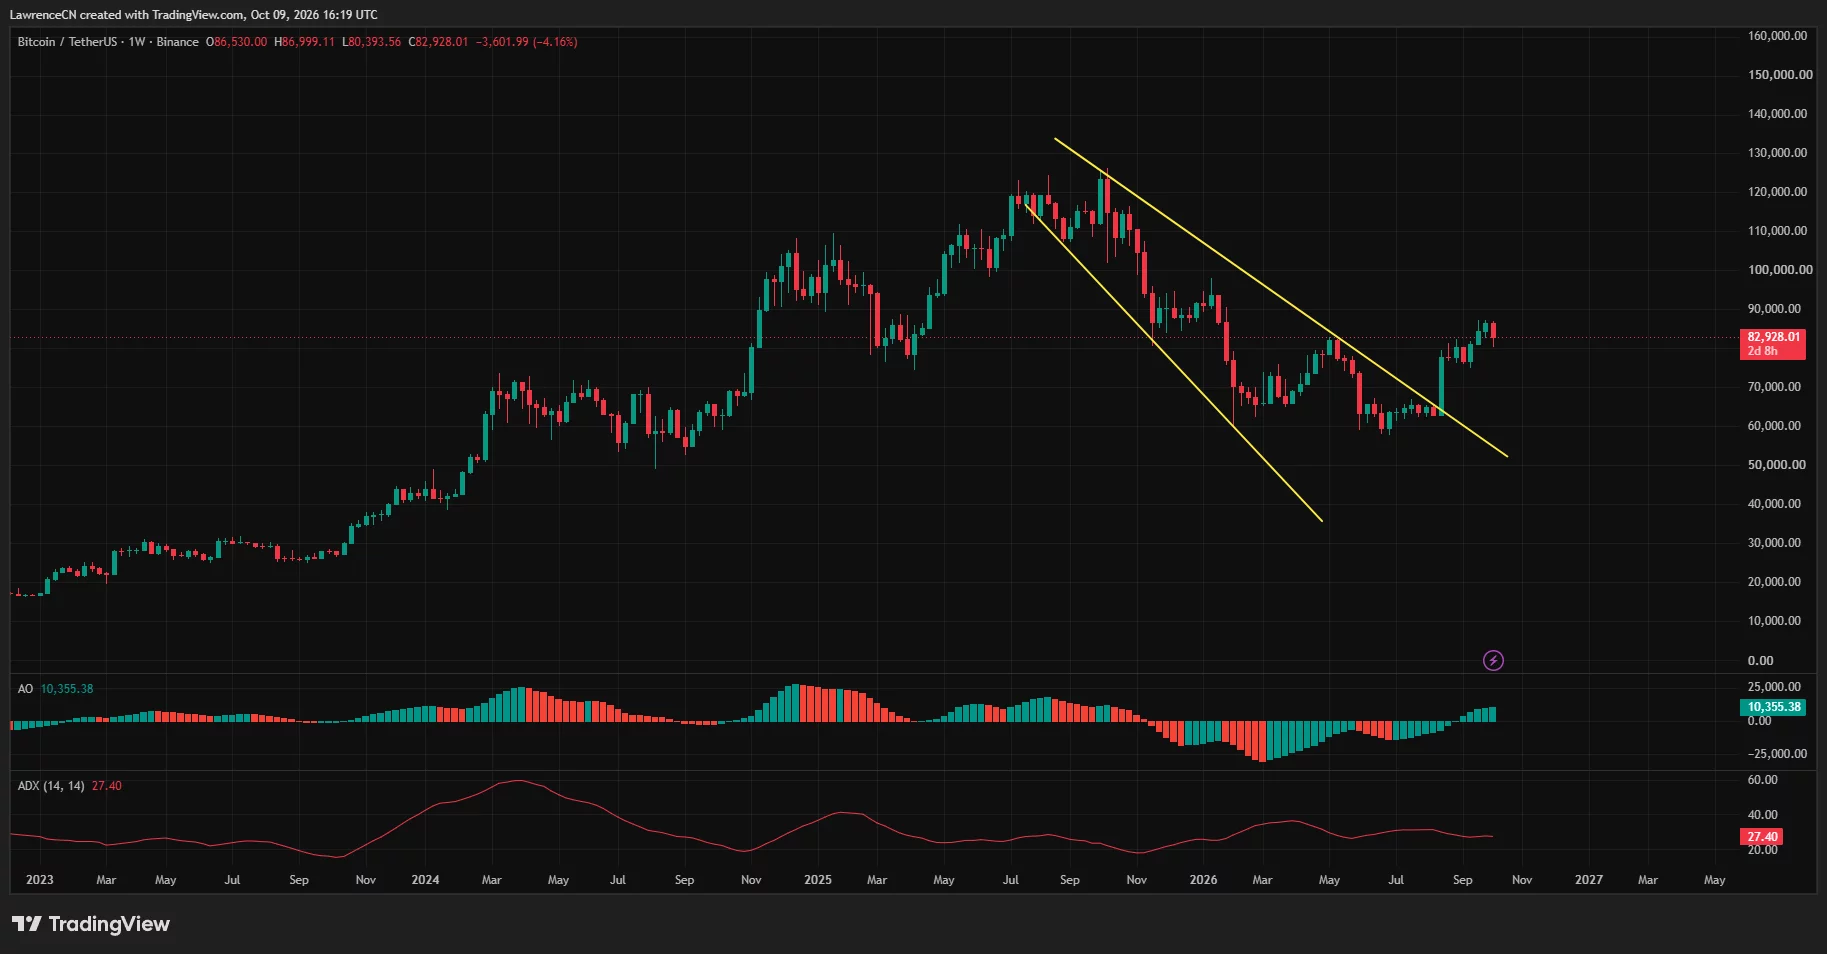
The weekly structure still promotes a cautious recovery scenario. The pullback has not yet brought Bitcoin back inside the defined wedge, although just remaining above the formation does not guarantee a new upward trend.
The weekly Awesome Oscillator recorded a positive score of 10,355.38, with green bars above the zero line. This reading contrasts with the bearish daily MACD and suggests a stronger momentum exists in the longer time frame.
The weekly ADX stood at 27.40, indicating an established trend; however, it measures strength rather than direction, and cannot independently confirm that Bitcoin will rise.
Collectively, the weekly breakout and the positive oscillator provide the potential for another attempt at reaching $87,000 if nearby support holds. A sustained move above that recent high would strengthen the technical arguments for targeting $90,000.
Repeated rejections below $87,000 would keep Bitcoin trapped beneath the ceiling that halted its early-October surge. In that case, the weekly recovery might require further consolidation before a clearer direction can be established.
Liquidation levels suggest $85,000 and $87,000 as key targets
The one-week liquidation heatmap by CoinGlass indicates Bitcoin trying to bounce back after a steep drop to $80,400. At the far right of the chart, leveraged positions are notably clustered above the current price, especially around the $85,000 and $87,000 levels.
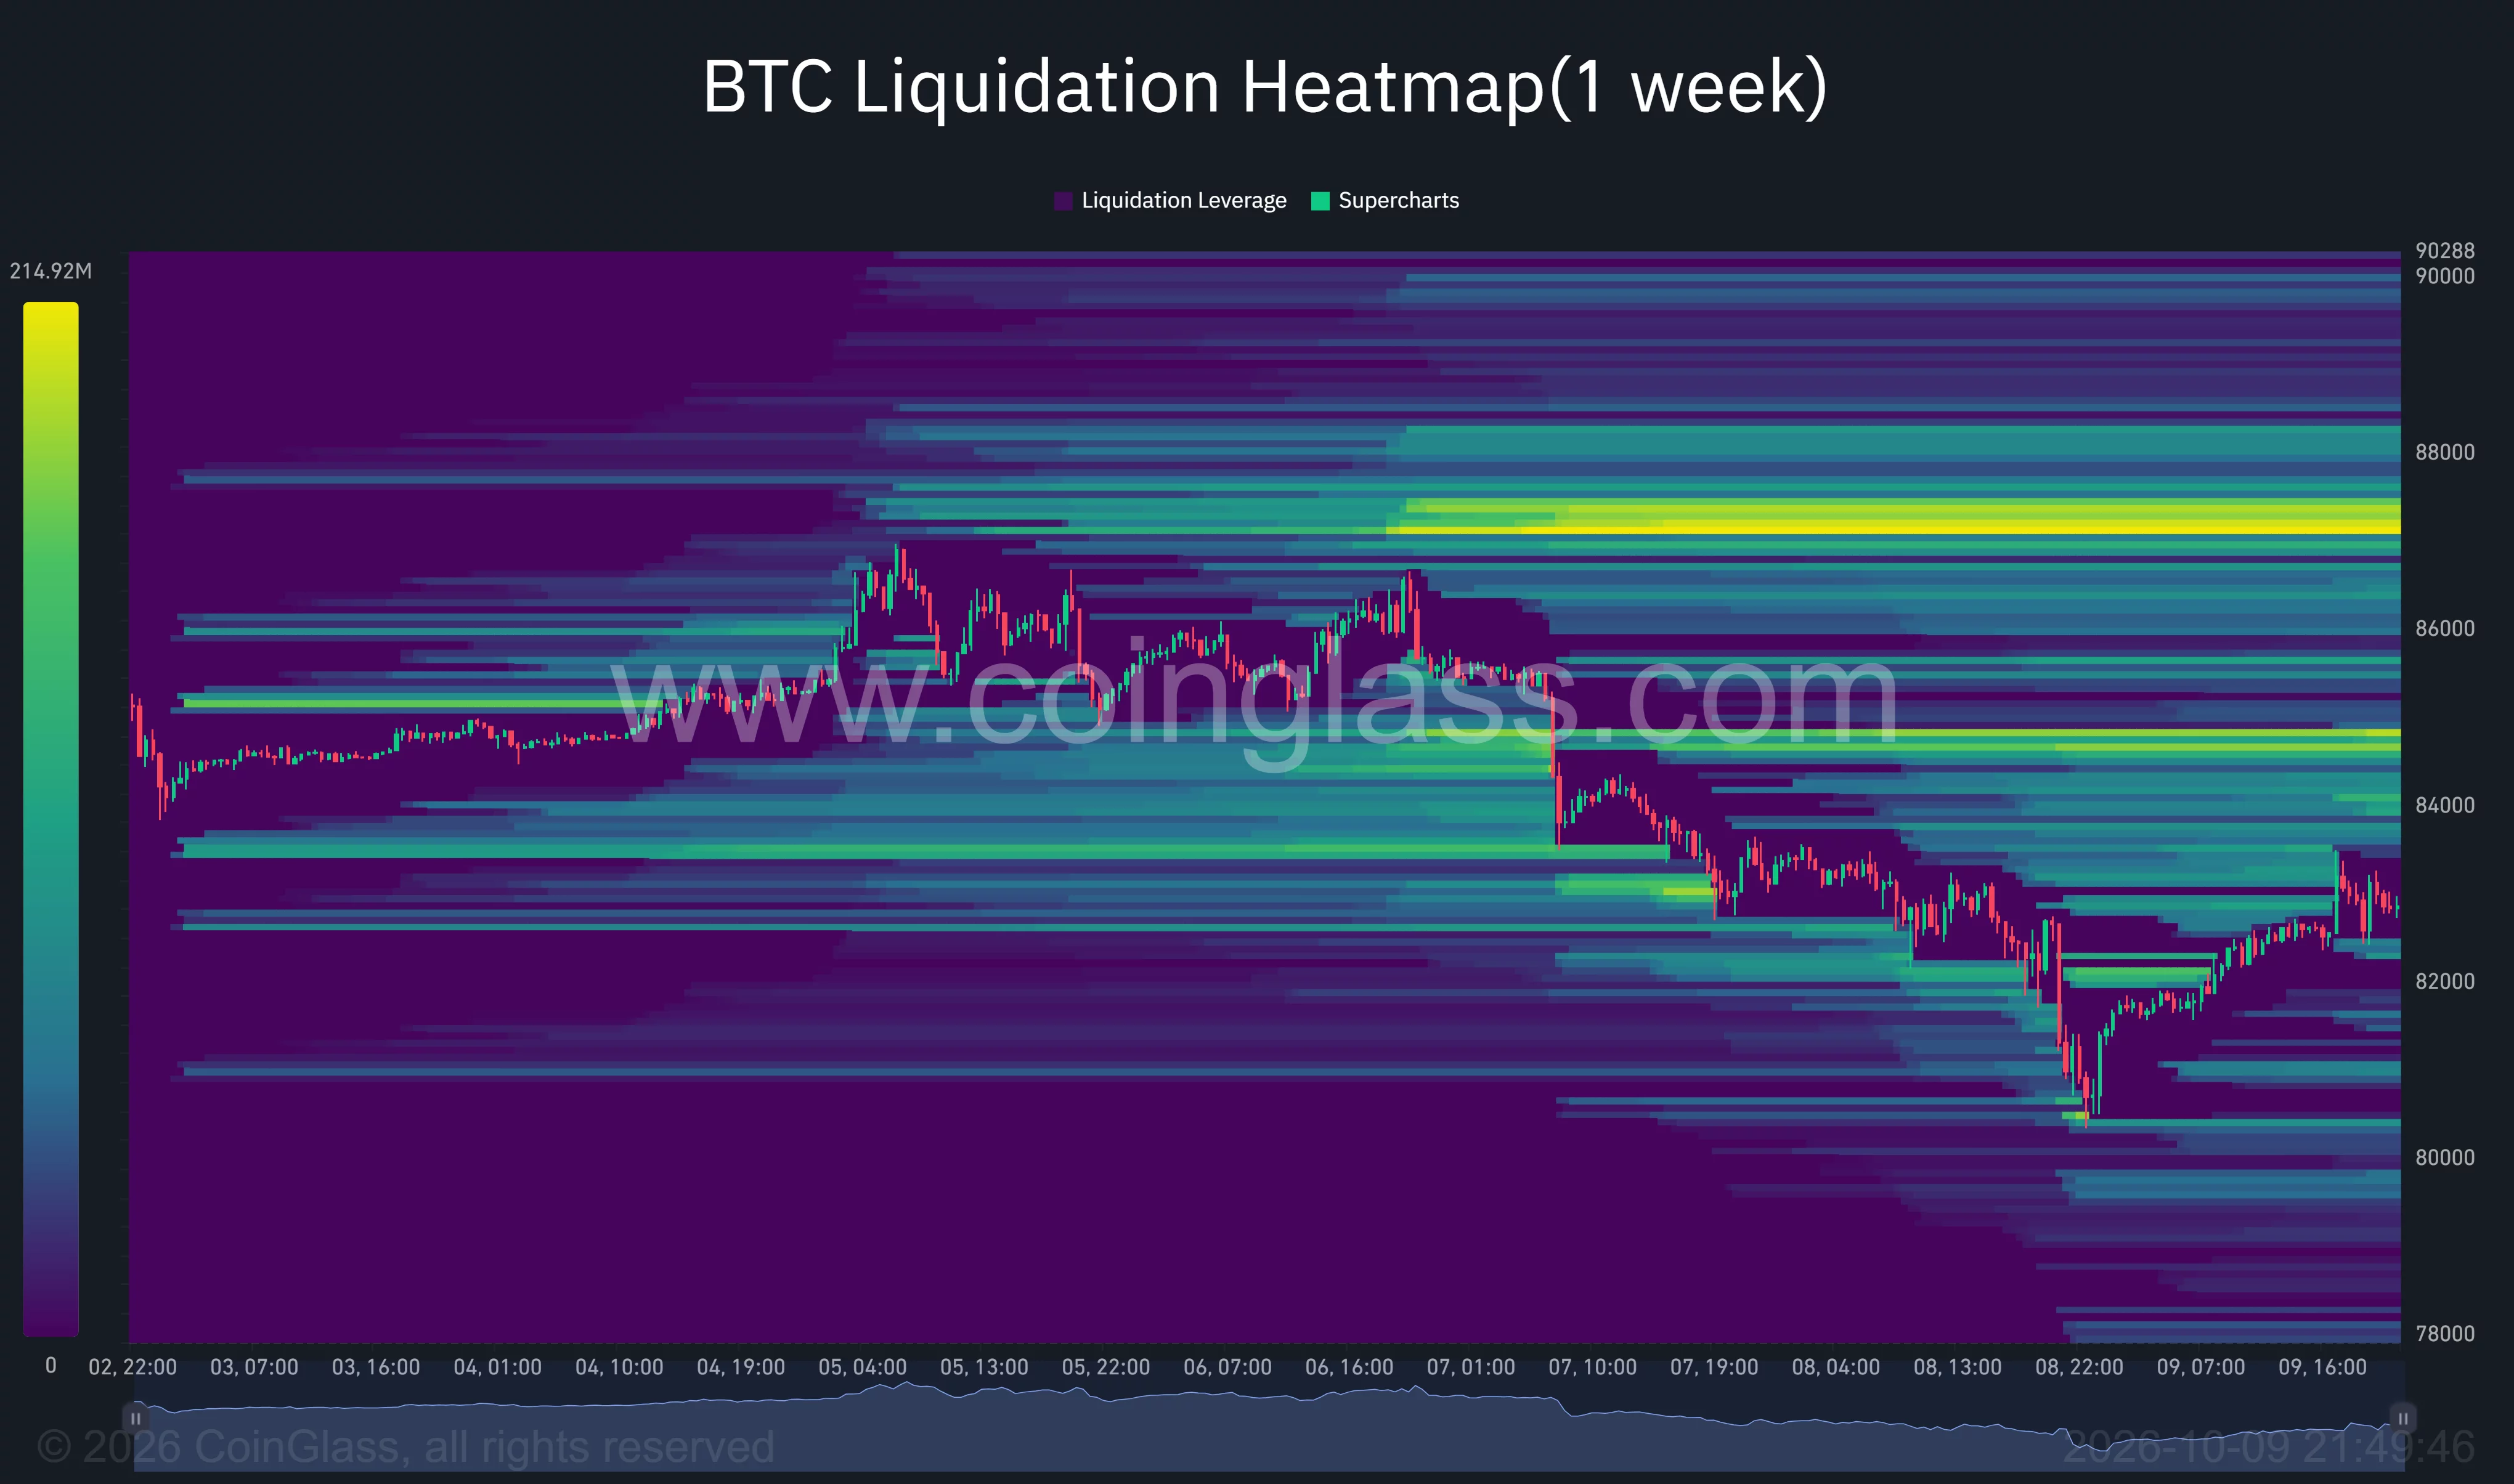
The most prominent overhead concentration is found around $87,000. If Bitcoin pushes into that area, the closure of at-risk short positions could enhance the upward movement, although the heatmap doesn’t confirm that buyers will be the ones to drive the price higher first.
Below the current market, visible clusters are observed around $82,000 and $80,400, creating space for volatility in both directions, especially if Bitcoin fails to maintain the levels gained during its last bounce.
A commentary posted on October 9, alongside a CryptoQuant chart, noted that about 55,600 BTC had moved to exchanges at a loss over the past 24 hours. The commentary interpreted these transfers as pressure on newer holders but also acknowledged that moving to exchanges does not necessarily signify completed sales.
This commentary also highlighted $1.09 billion in liquidations across the crypto market, including approximately $1.05 billion in long positions. These figures reflect the broader market situation rather than Bitcoin-specific liquidations alone.
The data regarding exchange transfers adds a supply concern to the overall technical analysis. It is unclear how much Bitcoin was sold or whether those who made the deposits will continue to sell.
US policy remains a significant factor in October
Movements in government-linked wallets have introduced further supply concerns. crypto.news reported that around 833.6 BTC, valued at approximately $71.56 million, shifted to Coinbase Prime, with 264.9 BTC associated with the Bitfinex case and 568.7 BTC linked to the forfeiture involving Potapenko and Turogin. The transfers have raised questions about potential sales rather than confirming any completed sales.
Minutes from the Federal Reserve’s September meeting indicated a quarter-point rise to a policy range of 3.75%–4%, with the next meeting scheduled for October 27–28. The minutes also mentioned rising Treasury yields and inflationary pressures driven by oil prices.
Reuters reported that many officials believe another hike by year-end is appropriate, while investors anticipate no changes in October but forecast a potential increase in December. An October hike thus remains a risk rather than a certainty.
For the remaining weeks in October, the technical outlook hinges on two key areas: support around $79,600–$80,400 and resistance near $86,500–$87,000. To bolster the case for recovery towards $90,000, it’s crucial to hold the support level and clear the resistance; failing to do so would shift focus back to the $75,000–$76,000 zone.
Disclosure: This article does not constitute investment advice. The content and materials presented on this page are intended solely for educational purposes.